Most organizations already have data sitting in multiple systems – CRMs, spreadsheets, cloud platforms, and financial tools. The problem is rarely the data itself. They do not communicate with each other in any useful way.
Our data analytics and visualization services using Power BI fix that. We connect your existing sources to a single, clean dashboard environment – one that your team can log into, understand immediately, and act on without needing a data analyst in the room. We handle the architecture, the connections, the visual design, and the ongoing maintenance. You get clarity without the complexity.
A dashboard that nobody looks at is not an asset – it is a line item. The reason most reporting tools go unused is simple: they show data without explaining what it means or why it matters.
Our data visualization service includes a dedicated storytelling layer. We take your sales performance numbers, customer behavior data, and market trends and package them into visual narratives that anyone on your team can follow. No data background required. The goal is not just to show what happened – it is to make sure the right people understand it and do something with it.
Knowing last quarter’s numbers is useful. Knowing what is likely to happen next quarter is what separates businesses that react from businesses that lead.
Our predictive analytics work is built on the same foundation as our broader data visualization outsourcing services – clean data, smart modelling, and visuals that make the outputs legible to non-technical teams. We surface trends, anticipate demand shifts, and help you spot risks before they become problems. This is especially valuable in data visualization for financial services, where early signals around buying behavior or market movement can make a significant difference.
Your business runs around the clock. Your data access should too.
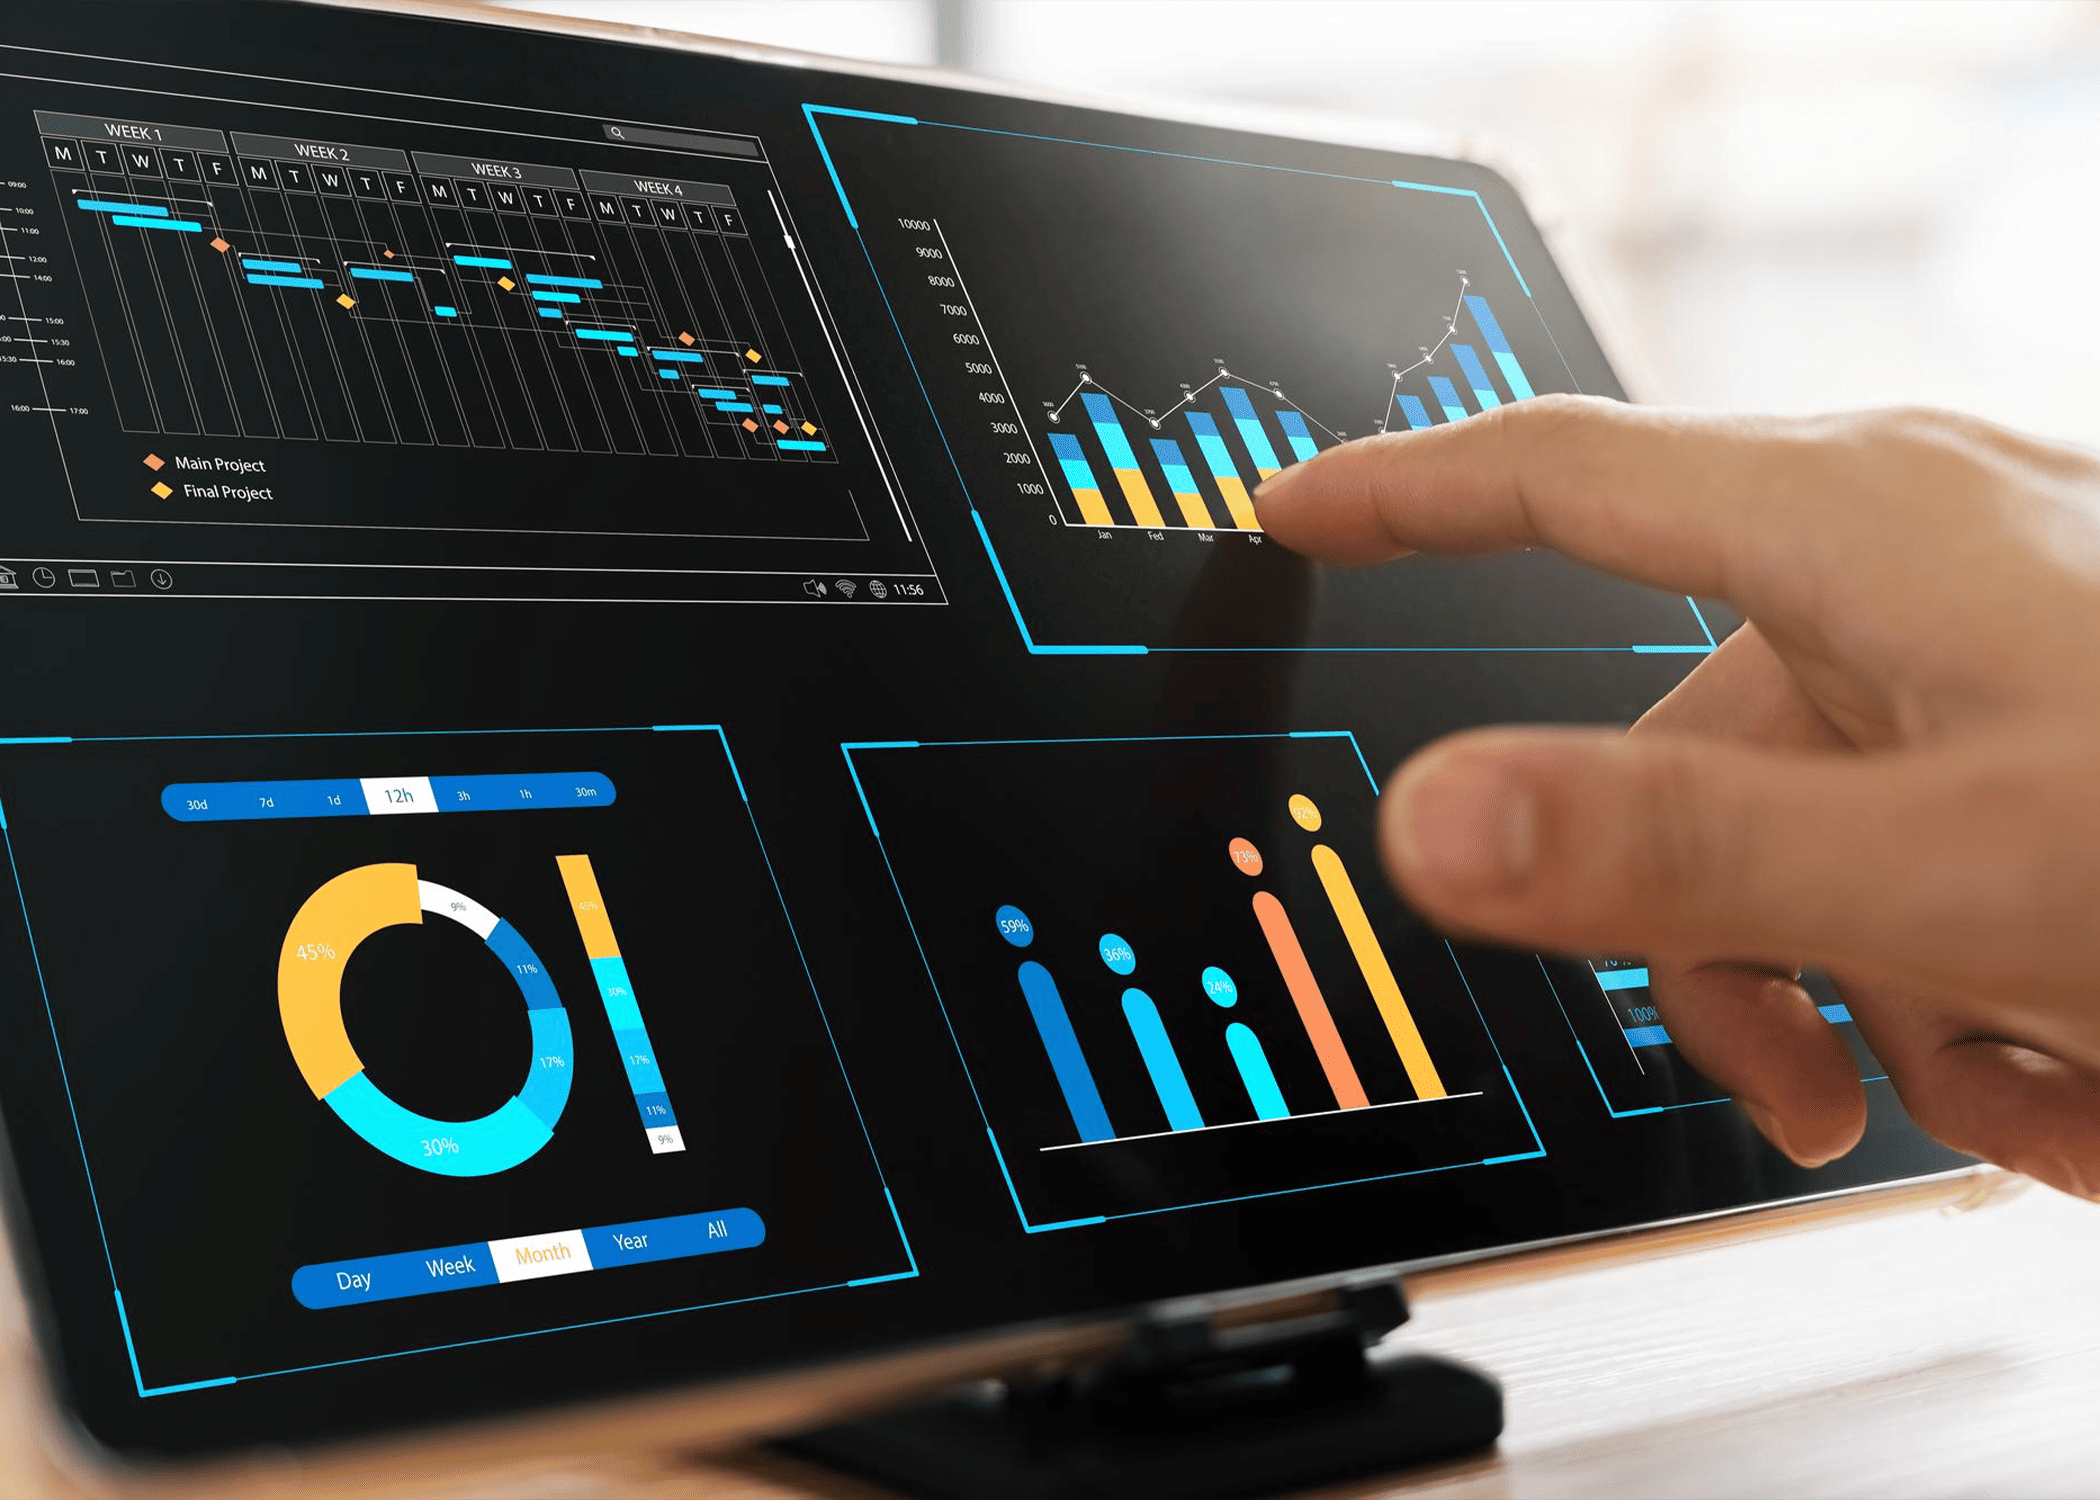
We build every dashboard to perform on any device: phone, tablet, or desktop, with no loss of clarity or detail. Powered by cloud infrastructure, our mobile-friendly visuals give your team access to key metrics whether they are on the floor, in a client meeting, or working remotely. Real-time data, wherever the work actually happens.
Static reports answer one question: what happened? Our interactive data visualization services answer the follow-up questions, too.
With click-and-tap navigation, drill-down filters, and dynamic views, your team can move from a high-level summary to a specific data point in seconds – without filing a request with IT or waiting for a custom report. It turns your data environment into something people actually explore, not something they glance at and close.